EN
EN



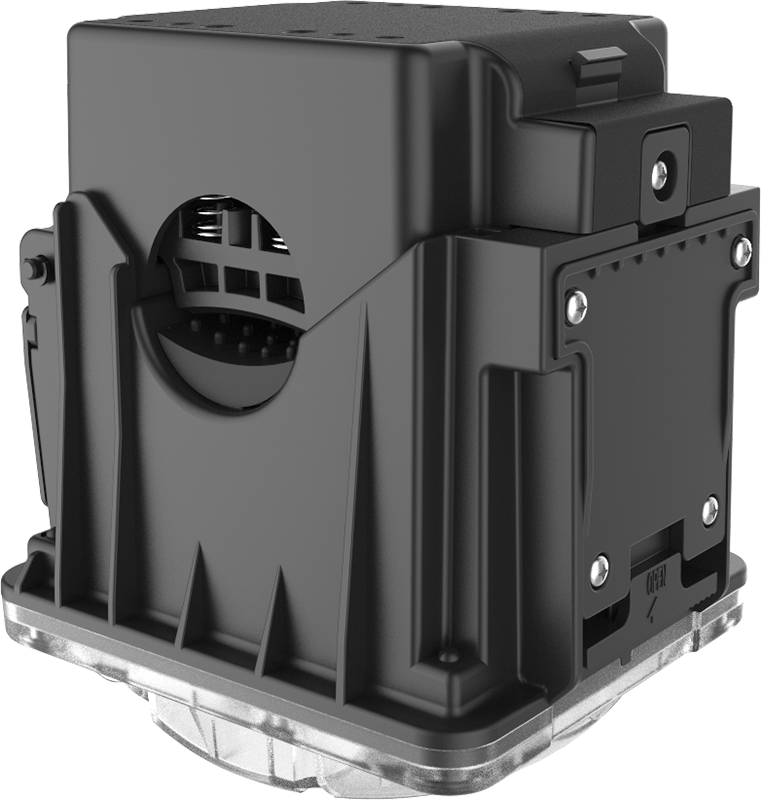
Modern power distribution networks are no longer static systems managed by periodic manual inspection. As smart grid projects expand across urban and industrial landscapes, the demand for continuous, real-time operational intelligence has grown sharply. At the heart of this transformation is the fault indicator — a device that has evolved from a simple visual alert tool into a critical data source that feeds the digital nervous system of today's intelligent grids. Without accurate, instantaneous fault data, even the most sophisticated smart grid architecture cannot fulfill its core promise of reliability and self-healing capability.
The question of why smart grid projects specifically need real-time data from a fault indicator is not merely technical — it is strategic. Grid operators, utilities, and energy infrastructure planners invest heavily in automation, remote monitoring, and predictive analytics. But these investments only yield their full value when the underlying field devices are capable of delivering timely, precise, and actionable data. A fault indicator that reports conditions in real time is not a peripheral accessory; it is a foundational input that determines how quickly faults are located, how intelligently network switching is executed, and how confidently operators can manage outage response without dispatching crews blindly into the field.
The Role of Real-Time Fault Data in Smart Grid Operations
From Reactive to Proactive Grid Management
Traditional power distribution relied heavily on customer complaints and manual patrol to locate faults after an outage had already occurred. This reactive model is incompatible with smart grid principles, which prioritize anticipation, speed, and minimal service disruption. When a fault indicator transmits real-time data to the grid management system the moment a fault condition is detected, the entire operational posture shifts from reactive to proactive.
Operators no longer wait for downstream consequences to reveal fault locations. Instead, the fault indicator provides immediate geographic and electrical context — identifying the faulted segment, the fault type, and the time of occurrence. This allows control room staff to isolate sections, reroute power, and restore supply to unaffected customers often within minutes rather than hours. The speed advantage alone justifies the integration of real-time fault indicator data into any serious smart grid deployment.
Furthermore, this proactive capability reduces the cascading risk of faults spreading across interconnected segments. Real-time data from a fault indicator enables faster protective relay coordination and smarter sectionalizer operation, both of which are essential for preventing localized faults from escalating into wide-area outages.
Supporting Distribution Automation Systems
Distribution automation is one of the defining pillars of any smart grid project. It relies on automated switching devices, remote terminal units, and communication infrastructure to reconfigure the network in response to abnormal conditions — often without human intervention. For this automation to function correctly, it needs accurate fault location data delivered in real time.
A fault indicator deployed at key nodes along a feeder acts as a sensor layer that feeds directly into the distribution automation logic. When the fault indicator detects overcurrent or earth fault conditions, it sends a signal upstream through the communication network, triggering predefined automation sequences. Without this input, automated reclosers and sectionalizers must operate on limited information, increasing the risk of unnecessary switching operations and extended isolation zones.
The integration of fault indicator data into SCADA and distribution management systems also improves the accuracy of fault location algorithms. Rather than relying purely on impedance-based calculations from the substation end — which carry significant error margins on long or branched feeders — operators can use the spatial data from multiple fault indicators to pinpoint fault locations with far greater precision. This is a direct performance multiplier for the entire distribution automation investment.
How Real-Time Data Improves Fault Isolation and Restoration Speed
Narrowing the Fault Search Zone
One of the most operationally significant contributions of a fault indicator in a smart grid environment is its ability to narrow the fault search zone. On a medium-voltage feeder that may stretch several kilometers with multiple branching points, locating a fault without field sensors can require extensive patrol time and multiple switching trials. Each of these steps prolongs the outage and increases operational cost.
When multiple fault indicators are deployed at strategic intervals — at branch points, cable joints, and switching stations — the last fault indicator that showed a fault signal before the breaker tripped provides a clear directional boundary. Crews can be dispatched directly to the confirmed faulted segment rather than walking or driving the entire feeder length. Field studies consistently show that real-time fault indicator data can reduce fault location time by a substantial margin, translating directly into faster restoration and lower operational expenditure.
This spatial narrowing capability becomes even more valuable in underground cable networks, where visual inspection is impossible and fault patrol without sensor data is inherently time-consuming and imprecise. For smart grid projects that include significant underground infrastructure, the fault indicator is not optional — it is operationally essential.
Enabling Faster Customer Restoration Decisions
Real-time data from a fault indicator directly supports faster customer restoration decisions by giving operators a clear picture of which segments are affected and which are not. In a feeder with multiple sectionalizing switches, knowing the precise faulted zone means that power can be restored to all healthy sections immediately while the faulted section remains isolated for repair.
Without real-time fault indicator data, operators must often take a conservative approach — keeping larger portions of the feeder de-energized until field crews confirm conditions. This conservative approach protects safety but extends the outage duration for customers who are not actually in the faulted zone. Real-time data eliminates this uncertainty and allows for more aggressive, customer-focused restoration strategies.
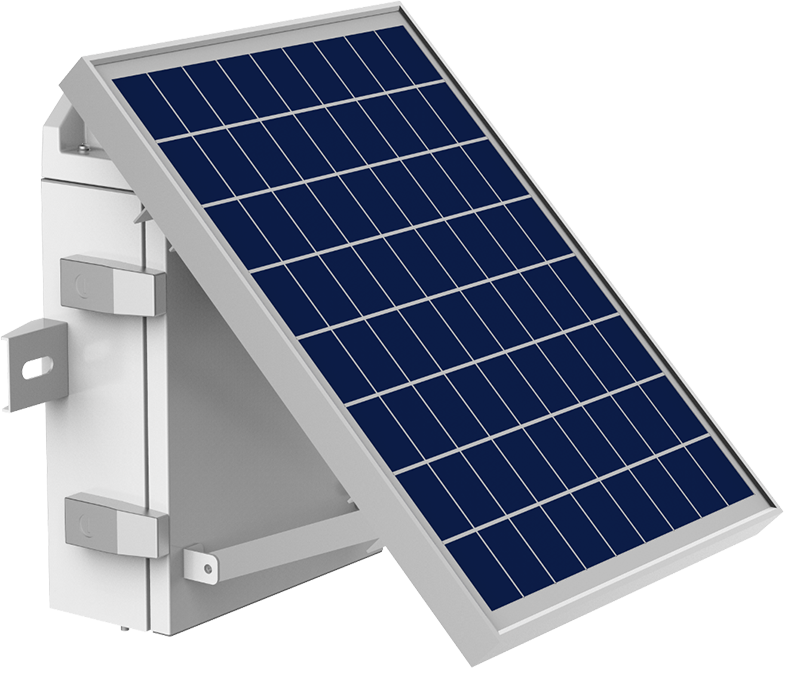
For utilities operating under regulatory performance frameworks that penalize prolonged outages — such as SAIDI and SAIFI-based incentive structures — this improvement in restoration speed has direct financial implications. The fault indicator, when integrated into a real-time data infrastructure, becomes a measurable contributor to regulatory compliance and customer satisfaction performance metrics.
Fault Indicator Data as a Smart Grid Intelligence Asset
Historical Data for Predictive Maintenance
Real-time data from a fault indicator is not only valuable in the immediate moment of a fault event. When logged and analyzed over time, fault indicator data builds a historical record of network behavior that supports predictive maintenance strategies. Patterns of repeated fault indicators in the same cable section, for example, may signal insulation degradation or repeated mechanical stress at a specific joint or splice.
Smart grid platforms that aggregate fault indicator event logs alongside environmental data, load profiles, and asset age records can apply analytics to identify at-risk sections before they experience a permanent fault. This predictive intelligence allows maintenance resources to be allocated based on evidence rather than fixed schedules, extending asset life and reducing emergency repair costs.
The fault indicator, in this context, is not just a detection device — it is a continuous monitoring instrument that contributes to the long-term health management of the distribution network. This broader value proposition is what distinguishes smart-grid-ready fault indicator designs from conventional passive reset indicators that provide no data connectivity.
Integration With Grid Analytics and Control Platforms
Modern smart grid control platforms are designed to ingest data from multiple field device types simultaneously — meters, sensors, protection relays, and field monitors. The fault indicator fits naturally into this ecosystem when it is equipped with appropriate communication interfaces such as GPRS, 4G, or fiber-connected RTU integration. Data from the fault indicator appears on the same operational dashboard as substation protection events, providing a unified situational awareness picture.
This integration enables correlation analytics that would otherwise be impossible. An operator observing a protection relay trip at the substation can immediately cross-reference which fault indicators along the feeder responded, instantly generating a probable fault location map. The decision support value of this correlated view is significant, reducing cognitive load on operators during high-stress outage events and improving decision quality under time pressure.
As grid analytics platforms incorporate machine learning capabilities, the fault indicator data stream becomes an input for pattern recognition models that can improve fault prediction, topology awareness, and automated switching recommendations over time. The more consistently and accurately a fault indicator reports real-time conditions, the more valuable it becomes as a training data source for these intelligent systems.
Design Characteristics That Enable Real-Time Performance
Communication Architecture and Latency Requirements
Not every fault indicator on the market is capable of delivering the real-time performance that smart grid projects require. The distinction lies primarily in communication architecture. A fault indicator that relies solely on a local visual reset indicator provides no remote data at all. A fault indicator with periodic polling-based communication may introduce delays of several minutes between fault occurrence and control room awareness. Neither of these is adequate for real-time smart grid operations.
For genuine real-time performance, a fault indicator must support event-triggered communication — meaning the device transmits a fault signal immediately upon detecting fault conditions, without waiting for a scheduled polling cycle. This push-based communication model ensures that the control platform receives fault data within seconds of the event, which is the latency standard required for effective distribution automation response.
The choice of communication medium also matters. Fault indicator devices deployed on overhead lines in remote areas may rely on cellular networks, making 4G LTE coverage a deployment prerequisite. In dense urban cable networks, fault indicators may communicate through power line carrier channels or fiber-integrated RTUs. Smart grid planners must evaluate communication reliability alongside detection accuracy when selecting a fault indicator for real-time data integration.
Power Supply Reliability and Environmental Durability
A fault indicator that fails to operate under adverse conditions provides no data at the moment it is most needed. Smart grid projects that depend on real-time fault data must therefore specify fault indicator devices that can maintain operation across a wide range of environmental conditions — temperature extremes, moisture, vibration, and UV exposure for outdoor installations.
Power supply design is equally critical. Many fault indicator units derive operating power from the current-carrying conductor they are monitoring, using current transformers to harvest energy. This approach is reliable under normal load conditions but must be validated for low-load scenarios where harvested energy may be insufficient for continuous communication. Some designs incorporate backup battery systems to ensure communication capability is maintained regardless of load conditions.
For smart grid projects, the operational continuity of each fault indicator in the network is a reliability concern, not just a procurement specification. A gap in the fault indicator coverage chain — caused by a failed device — can reintroduce the uncertainty that real-time monitoring was deployed to eliminate. Durability and power supply resilience are therefore non-negotiable design criteria for any fault indicator intended for smart grid integration.
Strategic Considerations for Smart Grid Planners
Deployment Density and Placement Logic
The effectiveness of a real-time fault indicator network depends significantly on deployment density and strategic placement. A single fault indicator per feeder provides minimal location precision. A well-designed deployment places fault indicators at every branch point, every significant cable section boundary, and at the entry point of all major load centers. This density creates a fine-grained fault location mesh that supports both immediate response and long-term analytics.
Placement logic must also account for fault current distribution patterns, which vary depending on feeder topology, transformer impedance, and neutral grounding arrangements. In networks with high-impedance earthing, earth fault currents may be too low for some fault indicator designs to detect reliably. Smart grid planners should verify that the fault indicator models selected are matched to the fault current characteristics of the specific network where they will be deployed.
Phased deployment is a practical approach for large networks, beginning with the highest-risk or most complex feeder segments where real-time fault data will deliver the greatest operational benefit. This allows teams to build integration experience and validate communication infrastructure before scaling the fault indicator deployment across the full network.
Return on Investment and Operational Value Quantification
Justifying the capital investment in a real-time fault indicator network requires a clear framework for quantifying operational value. The primary value drivers are reduction in mean time to restore, reduction in field patrol hours, improvement in SAIDI and SAIFI performance metrics, and avoidance of secondary damage that can result from delayed fault isolation.
Utilities that have implemented real-time fault indicator networks within smart grid projects typically report measurable reductions in outage duration and field crew dispatch costs. These savings accumulate over the operational life of the fault indicator devices, which in well-maintained networks can span a decade or more. When modeled over a multi-year horizon, the return on investment case for real-time fault indicator integration is generally strong, particularly in networks with a high frequency of fault events or long average restoration times.
Beyond direct cost savings, there is also the regulatory and reputational value of improved outage performance. Utilities operating in competitive or performance-regulated environments benefit from the fault indicator investment through improved compliance scores and stronger customer satisfaction outcomes. These indirect benefits, while harder to quantify precisely, are often significant enough to influence executive-level investment decisions in smart grid technology programs.
FAQ
What makes a fault indicator suitable for smart grid integration?
A fault indicator suitable for smart grid integration must support event-triggered real-time communication, have a reliable power supply independent of network load conditions, and be compatible with the communication infrastructure used by the grid management platform. It should also be capable of detecting both overcurrent and earth fault conditions with sufficient sensitivity to match the network's fault current characteristics.
How does real-time data from a fault indicator differ from conventional fault detection?
Conventional fault detection relies on protective relay operation at the substation level, which confirms that a fault has occurred but provides no information about where along the feeder the fault is located. A fault indicator with real-time communication provides location-specific data immediately after fault detection, enabling precise isolation and reducing the search zone for field crews from an entire feeder to a specific segment.
Can a fault indicator contribute to predictive maintenance in a smart grid?
Yes. When fault indicator event data is logged and analyzed over time, recurring fault signals in the same cable section or at the same asset can indicate progressive insulation failure or mechanical deterioration. This historical pattern data feeds predictive maintenance models that allow utilities to schedule intervention before a permanent fault occurs, reducing emergency repair costs and improving network reliability.
How many fault indicators are needed for effective real-time coverage on a feeder?
The optimal number depends on feeder length, branching complexity, and the desired fault location precision. As a general principle, a fault indicator should be placed at every significant branch point and section boundary so that the faulted segment can be identified by comparing which devices responded to the fault event. Longer or more complex feeders typically require higher deployment density to achieve the fault location resolution that smart grid automation systems require.
Table of Contents
- The Role of Real-Time Fault Data in Smart Grid Operations
- How Real-Time Data Improves Fault Isolation and Restoration Speed
- Fault Indicator Data as a Smart Grid Intelligence Asset
- Design Characteristics That Enable Real-Time Performance
- Strategic Considerations for Smart Grid Planners
-
FAQ
- What makes a fault indicator suitable for smart grid integration?
- How does real-time data from a fault indicator differ from conventional fault detection?
- Can a fault indicator contribute to predictive maintenance in a smart grid?
- How many fault indicators are needed for effective real-time coverage on a feeder?